Method uses a soil and hammer model and
calculates the force using the measured
velocity and then compares the calculated
force with the measured force; if the values
do not match, the soil model is changed,
and the analysis repeated.
When piles are driven, soil resistance
that opposes the penetration of piles consists
of two components, such as static
resistance and dynamic resistance
(Rausche et. al, 1985). CAPWAP computes
Bridge, Bent
No
Pile Size &
MFSR (kip)
Tip Elevation
(ft)/
Length (ft)
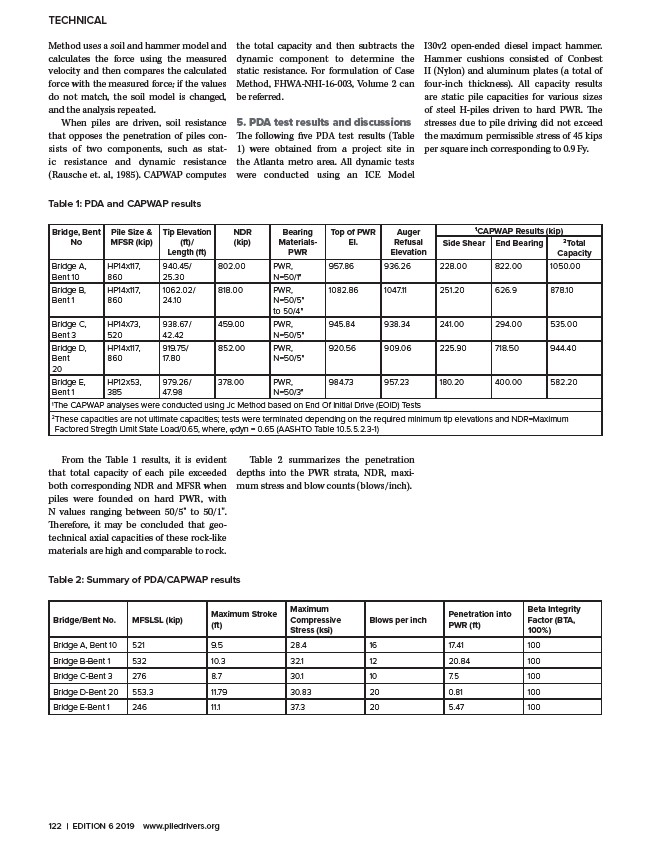
From the Table 1 results, it is evident
that total capacity of each pile exceeded
both corresponding NDR and MFSR when
piles were founded on hard PWR, with
N values ranging between 50/5" to 50/1".
Therefore, it may be concluded that geotechnical
axial capacities of these rock-like
materials are high and comparable to rock.
the total capacity and then subtracts the
dynamic component to determine the
static resistance. For formulation of Case
Method, FHWA-NHI-16-003, Volume 2 can
be referred.
5. PDA test results and discussions
The following five PDA test results (Table
1) were obtained from a project site in
the Atlanta metro area. All dynamic tests
were conducted using an ICE Model
NDR
(kip)
Table 2 summarizes the penetration
depths into the PWR strata, NDR, maximum
stress and blow counts (blows/inch).
TECHNICAL
Table 1: PDA and CAPWAP results
Table 2: Summary of PDA/CAPWAP results
Bearing
Materials-
PWR
Top of PWR
El.
I30v2 open-ended diesel impact hammer.
Hammer cushions consisted of Conbest
II (Nylon) and aluminum plates (a total of
four-inch thickness). All capacity results
are static pile capacities for various sizes
of steel H-piles driven to hard PWR. The
stresses due to pile driving did not exceed
the maximum permissible stress of 45 kips
per square inch corresponding to 0.9 Fy.
Auger
Refusal
Elevation
1CAPWAP Results (kip)
Side Shear End Bearing 2Total
Capacity
Bridge A,
Bent 10
HP14x117,
860
940.45/
25.30
802.00 PWR,
N=50/1"
957.86 936.26 228.00 822.00 1050.00
Bridge B,
Bent 1
HP14x117,
860
1062.02/
24.10
818.00 PWR,
N=50/5"
to 50/4"
1082.86 1047.11 251.20 626.9 878.10
Bridge C,
Bent 3
HP14x73,
520
938.67/
42.42
459.00 PWR,
N=50/5"
945.84 938.34 241.00 294.00 535.00
Bridge D,
Bent
20
HP14x117,
860
919.75/
17.80
852.00 PWR,
N=50/5"
920.56 909.06 225.90 718.50 944.40
Bridge E,
Bent 1
HP12x53,
385
979.26/
47.98
378.00 PWR,
N=50/3"
984.73 957.23 180.20 400.00 582.20
1The CAPWAP analyses were conducted using Jc Method based on End Of Initial Drive (EOID) Tests
2 These capacities are not ultimate capacities; tests were terminated depending on the required minimum tip elevations and NDR=Maximum
Factored Stregth Limit State Load/0.65, where, jdyn = 0.65 (AASHTO Table 10.5.5.2.3-1)
Bridge/Bent No. MFSLSL (kip) Maximum Stroke
(ft)
Maximum
Compressive
Stress (ksi)
Blows per inch Penetration into
PWR (ft)
Beta Integrity
Factor (BTA,
100%)
Bridge A, Bent 10 521 9.5 28.4 16 17.41 100
Bridge B-Bent 1 532 10.3 32.1 12 20.84 100
Bridge C-Bent 3 276 8.7 30.1 10 7.5 100
Bridge D-Bent 20 553.3 11.79 30.83 20 0.81 100
Bridge E-Bent 1 246 11.1 37.3 20 5.47 100
122 | EDITION 6 2019 www.piledrivers.org
/www.piledrivers.org