The Results are In!
See how attendees at PDCA’s annual conference rated their experience in Orlando
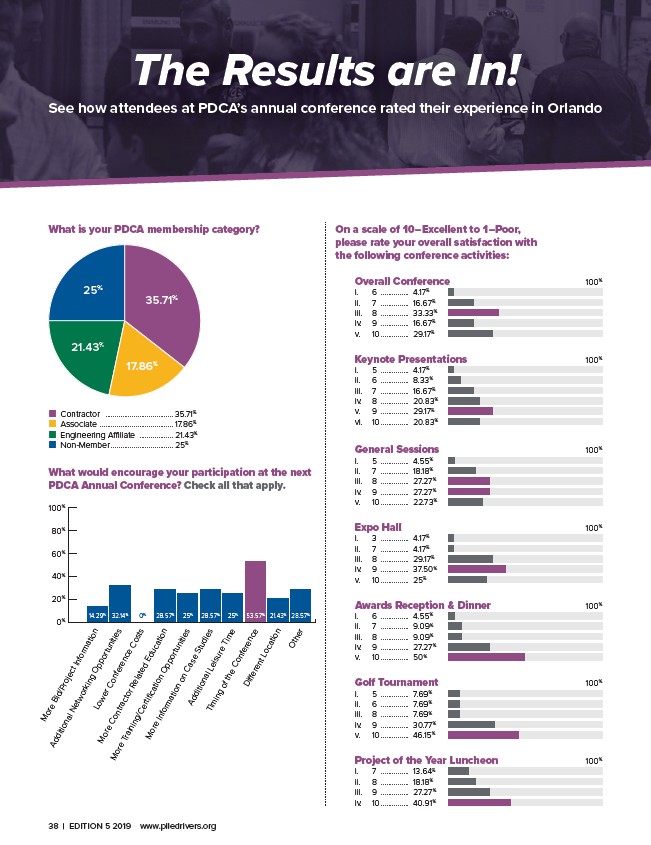
On a scale of 10–Excellent to 1–Poor,
please rate your overall satisfaction with
the following conference activities:
Overall Conference 100%
i. 6……………… 4.17%
ii. 7… …………… 16.67%
iii. 8… …………… 33.33%
iv. 9……………… 16.67%
v. 10……………… 29.17%
Keynote Presentations 100%
i. 5… …………… 4.17%
ii. 6……………… 8.33%
iii. 7… …………… 16.67%
iv. 8… …………… 20.83%
v. 9……………… 29.17%
vi. 10……………… 20.83%
General Sessions 100%
i. 5… …………… 4.55%
ii. 7… …………… 18.18%
iii. 8… …………… 27.27%
iv. 9……………… 27.27%
v. 10……………… 22.73%
Expo Hall 100%
i. 3… …………… 4.17%
ii. 7… …………… 4.17%
iii. 8… …………… 29.17%
iv. 9……………… 37.50%
v. 10……………… 25%
Awards Reception & Dinner 100%
i. 6……………… 4.55%
ii. 7… …………… 9.09%
iii. 8… …………… 9.09%
iv. 9……………… 27.27%
v. 10……………… 50%
Golf Tournament 100%
i. 5… …………… 7.69%
ii. 6……………… 7.69%
iii. 8… …………… 7.69%
iv. 9……………… 30.77%
v. 10……………… 46.15%
Project of the Year Luncheon 100%
i. 7… …………… 13.64%
ii. 8… …………… 18.18%
iii. 9……………… 27.27%
iv. 10……………… 40.91%
What is your PDCA membership category?
25%
Contractor… ……………………………… 35.71%
Associate…………………………………… 17.86%
Engineering Affiliate… ……………… 21.43%
Non-Member……………………………… 25%
What would encourage your participation at the next
PDCA Annual Conference? Check all that apply.
14.29% 32.14% 28.57% 0% 25% 28.57% 25% 53.57% 21.43% 28.57%
More Bid/Project Information
Additional Networking Opportunities
Additional Leisure Time
Timing of the Conference
Lower Conference Costs
More Contractor Related Education
More Training/Certification Opportunities
More Information on Case Studies
Different Location
Other
100%
80%
60%
40%
20%
0%
35.71%
17.86%
21.43%
38 | EDITION 5 2019 www.piledrivers.org
/www.piledrivers.org