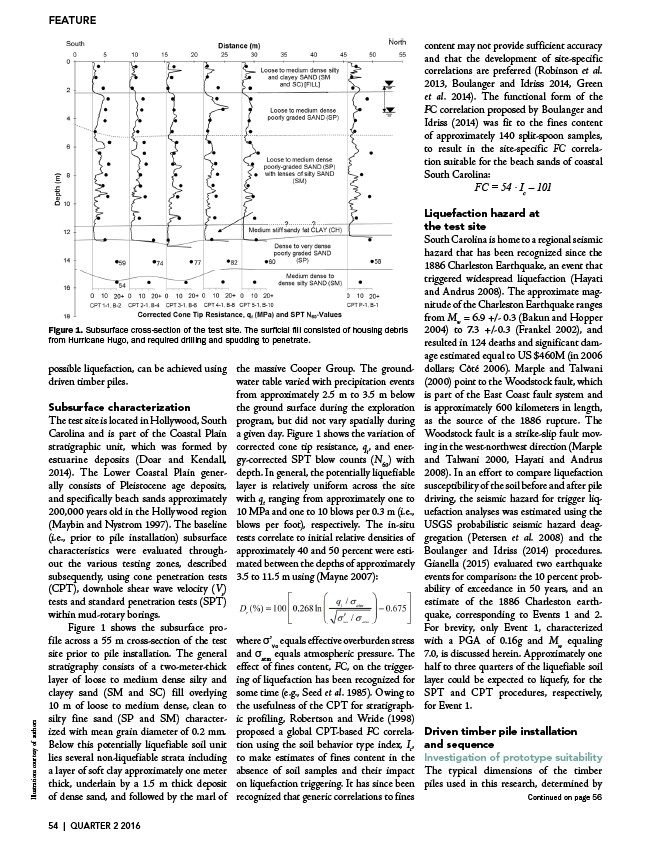
Figure 1. Subsurface cross-section of the test site. The surficial fill consisted of housing debris
from Hurricane Hugo, and required drilling and spudding to penetrate
possible liquefaction, can be achieved using
driven timber piles.
Subsurface characterization
The test site is located in Hollywood, South
Carolina and is part of the Coastal Plain
stratigraphic unit, which was formed by
estuarine deposits (Doar and Kendall,
2014). The Lower Coastal Plain generally
to make estimates of fines content in the absence of soil samples and their impact on
liquefaction triggering. It has since been recognized that generic correlations to fines content
may not provide sufficient accuracy and that the development of site-specific correlations are
preferred (Robinson et al. 2013, Boulanger and Idriss 2014, Green et al. 2014). The
functional form of the FC correlation proposed by Boulanger and Idriss (2014) was fit to the
fines content of approximately 140 split-spoon samples, to result in the site-specific FC
correlation suitable for the beach sands of coastal South Carolina:
FC 54 I 101 consists of Pleistocene age deposits,
(2)
c and specifically beach sands approximately
200,000 years old in the Hollywood region
(Maybin and Nystrom 1997). The baseline
(i.e., prior to pile installation) subsurface
characteristics were evaluated throughout
Liquefaction Hazard at the Test Site
South Carolina is home to a regional seismic hazard that has been recognized since the 1886
Charleston Earthquake,the various an testing event zones,that triggered described
widespread liquefaction (Hayati and Andrus
2008). The subsequently,approximate using magnitude cone penetration of the tests
Charleston Earthquake ranges from Mw = 6.9 +/-
0.3 (Bakun and (CPT),Hopper downhole 2004)shear to wave 7.3 velocity +/-0.3 (V()
sFrankel 2002), and resulted in 124 deaths and
significant damage tests and estimated standard penetration equal to tests US (SPT)$460M
(in 2006 dollars; Côté 2006). Marple and
Talwani (2000)within point mud-to rotary the borings.
Woodstock fault, which is part of the East Coast fault system and
approximately Figure across 600 1 shows the subsurface profile
a kilometers 55 m cross-section in length,of the as test
the source of the 1886 rupture. The Woodstock
fault is a strike-site prior slip fault to pile moving installation.in The the west-general
northwest direction (Marple and Talwani 2000,
Hayati and Andrus stratigraphy 2008).consists In of effort a two-to meter-compare thick
liquefaction susceptibility of the soil before
and after pile layer driving,of loose the to seismic medium dense hazard silty for and
trigger liquefaction analyses was estimated using
the USGS clayey probabilistic sand (SM seismic and SC) hazard fill overlying
deaggregation (Petersen et al. 2008) and the
Boulanger and 10 m Idriss of loose (2014)to medium procedures.dense, clean Gianella to
(2015) evaluated two earthquake events for
comparison: silty the fine 10%sand probability (SP and SM)with mean grain diameter of characterized
of exceedance 0.2 mm.
in 50 years, and an estimate of the 1886
Charleston earthquake, corresponding to Events 1 and 2. For brevity, only Event 1,
characterized with a PGA of 0.16g and MW = 7.0, is discussed herein. Approximately onehalf
Below this potentially liquefiable soil unit
lies several non-liquefiable strata including
a layer of soft clay approximately one meter
thick, underlain by a 1.5 m thick deposit
of dense sand, and followed by the marl of
the massive Cooper Group. The groundwater
table varied with precipitation events
from approximately 2.5 m to 3.5 m below
the ground surface during the exploration
program, but did not vary spatially during
a given day. Figure 1 shows the variation of
corrected cone tip resistance, qt, and energy
corrected SPT blow counts (N60) with
depth. In general, the potentially liquefiable
layer is relatively uniform across the site
with qt ranging from approximately one to
10 MPa and one to 10 blows per 0.3 m (i.e.,
blows per foot), respectively. The in-situ
tests correlate to initial relative densities of
approximately 40 and 50 percent were estimated
between the depths of approximately
3.5 to 11.5 m using (Mayne 2007):
where σ’vo equals effective overburden stress
and σatm equals atmospheric pressure. The
effect of fines content, FC, on the triggering
of liquefaction has been recognized for
some time (e.g., Seed et al. 1985). Owing to
the usefulness of the CPT for stratigraphic
profiling, Robertson and Wride (1998)
proposed a global CPT-based FC correlation
using the soil behavior type index, Ic,
to make estimates of fines content in the
absence of soil samples and their impact
on liquefaction triggering. It has since been
recognized that generic correlations to fines
to three quarters of the liquefiable soil layer could be expected to liquefy, for the SPT
and CPT procedures, respectively, for Event 1.
content may not provide sufficient accuracy
and that the development of site-specific
correlations are preferred (Robinson et al.
2013, Boulanger and Idriss 2014, Green
et al. 2014). The functional form of the
FC correlation proposed by Boulanger and
Idriss (2014) was fit to the fines content
of approximately 140 split-spoon samples,
to result in the site-specific FC correlation
suitable for the beach sands of coastal
South Carolina:
FC = 54 · Ic – 101
Liquefaction hazard at
the test site
South Carolina is home to a regional seismic
hazard that has been recognized since the
1886 Charleston Earthquake, an event that
triggered widespread liquefaction (Hayati
and Andrus 2008). The approximate magnitude
of the Charleston Earthquake ranges
from Mw = 6.9 +/- 0.3 (Bakun and Hopper
2004) to 7.3 +/-0.3 (Frankel 2002), and
resulted in 124 deaths and significant damage
estimated equal to US $460M (in 2006
dollars; Côté 2006). Marple and Talwani
(2000) point to the Woodstock fault, which
is part of the East Coast fault system and
is approximately 600 kilometers in length,
as the source of the 1886 rupture. The
Woodstock fault is a strike-slip fault moving
in the west-northwest direction (Marple
and Talwani 2000, Hayati and Andrus
2008). In an effort to compare liquefaction
susceptibility of the soil before and after pile
driving, the seismic hazard for trigger liquefaction
analyses was estimated using the
USGS probabilistic seismic hazard deaggregation
(Petersen et al. 2008) and the
Boulanger and Idriss (2014) procedures.
Gianella (2015) evaluated two earthquake
events for comparison: the 10 percent probability
of exceedance in 50 years, and an
estimate of the 1886 Charleston earthquake,
corresponding to Events 1 and 2.
For brevity, only Event 1, characterized
with a PGA of 0.16g and Mw equaling
7.0, is discussed herein. Approximately one
half to three quarters of the liquefiable soil
layer could be expected to liquefy, for the
SPT and CPT procedures, respectively,
for Event 1.
Driven timber pile installation
and sequence
Investigation of prototype suitability
The typical dimensions of the timber
piles used in this research, determined by
Figure 1. Subsurface cross-section of the test site. The surficial fill consisted of housing debris
from Hurricane Hugo, and required drilling and spudding to penetrate.
Continued on page 56
FEATURE
Illustrations courtesy of authors
54 | QUARTER 2 2016
/procedures.de
/procedures.de
/procedures.de